Futuristic Global Data Visualization With Dynamic Bar Graphs
By YuElaineOne great value subscription from $16.50/month
- Unlimited downloads of 27+ million creative assets
- AI Tools: video, image and more
- Lifetime commercial license
- Easy cancellation
- Length
- 0:20
- Resolution
- 1920 x 1080
- File Size
- 37.6 MB
- Frame Rate
- 30 fps
- Alpha Channel
- No
- Looped
- No
- Video Encoding
- H.264
- Orientation
- Horizontal
- Commercial License
- Further Information
Description
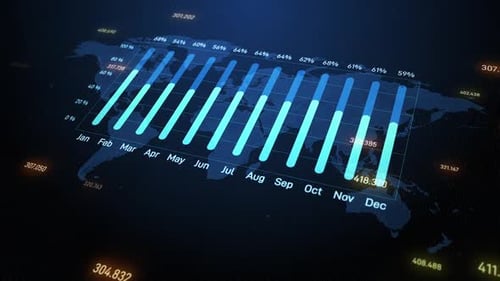
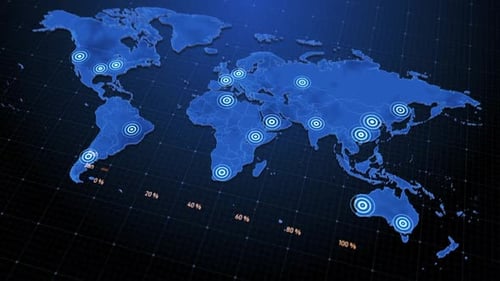
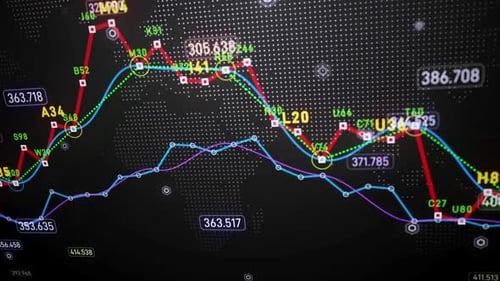
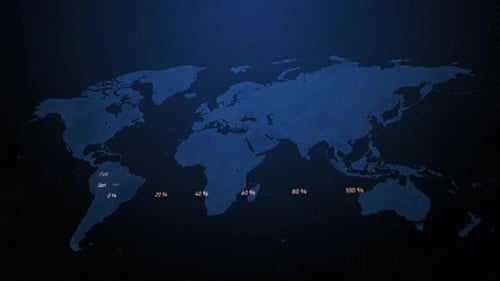
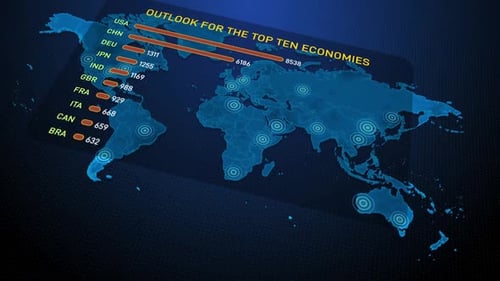
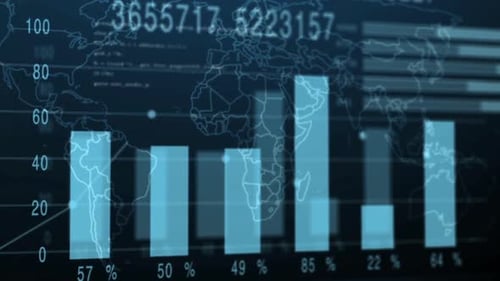
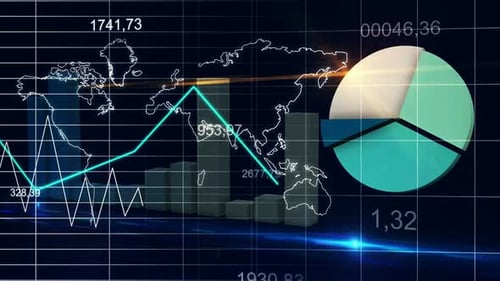
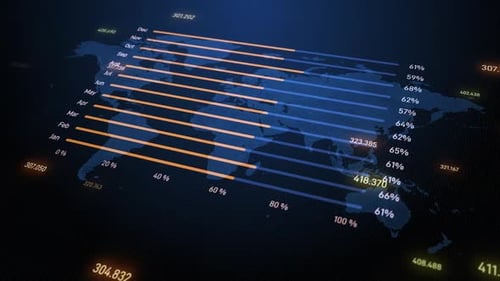
This sophisticated data visualization features a stylized world map as a background for dynamic, animated bar charts. The scene begins with a textured global map over which glowing numerical data points float in a three-dimensional space. As the camera pans slightly, a set of twelve horizontal bar graphs appears, representing the months of the year from January to December. These bars, colored in contrasting orange and blue hues, animate fluidly to reflect changing values over time. To the right of the bars, percentage indicators provide precise data feedback, while the bottom axis shows a scale from zero to one hundred percent. The visual aesthetic is clean and high-tech, utilizing a dark blue palette with vibrant accents to ensure legibility and professional appeal. This clip is ideal for corporate presentations, financial reports, or news segments that require an engaging way to represent global statistics, market trends, or analytical findings. The smooth camera movement and high-frequency data updates create a sense of urgency and real-time information processing, making it a powerful tool for modern storytelling in business and technology sectors. The inclusion of the world map anchor provides a geographic context to the data, suggesting international reach or multi-national performance metrics. Every element is designed to enhance the professional quality of a video project, providing a ready-made asset for complex informational displays.