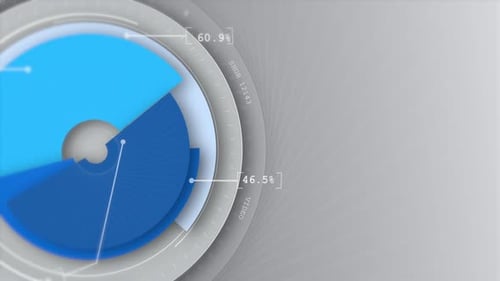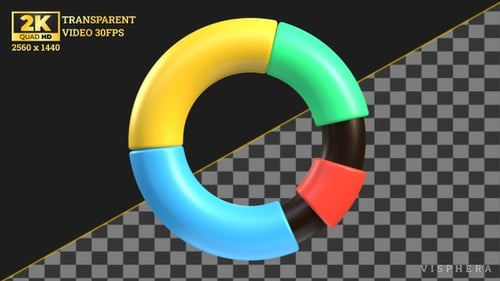
Circle Data Chart
By VispheraOne great value subscription from $16.50/month
- Unlimited downloads of 27+ million creative assets
- AI Tools: video, image and more
- Lifetime commercial license
- Easy cancellation
- Length
- 0:06
- Resolution
- 2560 x 1440
- File Size
- 302 MB
- Frame Rate
- 30 fps
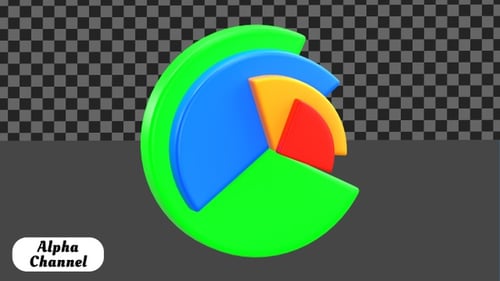
- Alpha Channel
- Yes
- Looped
- Yes
- Video Encoding
- ProRes
- Orientation
- Horizontal
- Commercial License
- Further Information
Description
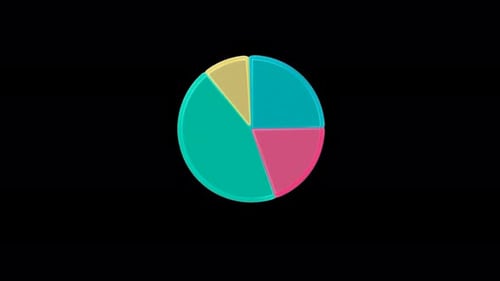
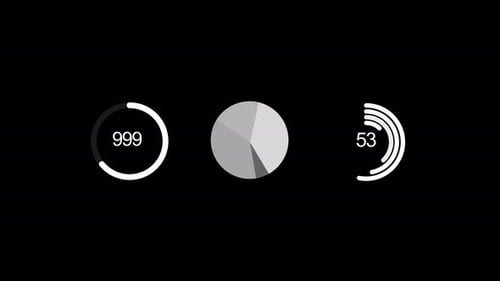
This high-quality 3D animation features a vibrant circular infographic with rotating segments. The colorful pieces—blue, yellow, green, and red—glide smoothly around a central axis over a dark base, creating a dynamic sense of progress and data flow. The glossy texture and subtle lighting give the graphic a polished, professional look suitable for high-end corporate presentations or data-driven content. The clean movement and isolated black background provide an excellent tool for editors to enhance business reports, financial overviews, or tech-focused explainers. The fluid, rhythmic rotation serves as a compelling visual metaphor for growth, cycles, or continuous processes. This versatile visual element can be seamlessly integrated into various digital projects to elevate the production value and engage viewers with its modern aesthetic. Its bold colors and sleek finish make it an ideal choice for social media marketing, educational videos, and analytical software demonstrations. By focusing on the movement of distinct data points, the animation helps simplify complex concepts for the audience.