Description
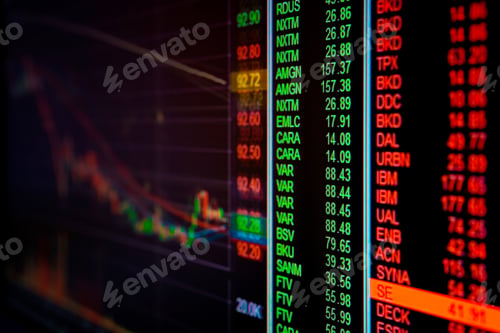
An extreme close-up captures the intricacies of candlestick charts, illustrating the dynamic trends of financial markets. Lines of green and red intersect against a black background, highlighting the rise and fall of values. This image is a good choice for projects related to finance, investment, trading, data analysis, or even the abstract representation of market forces. This technical shot provides a unique visual for presentations, reports, websites, or creative concepts centered on the world of finance.