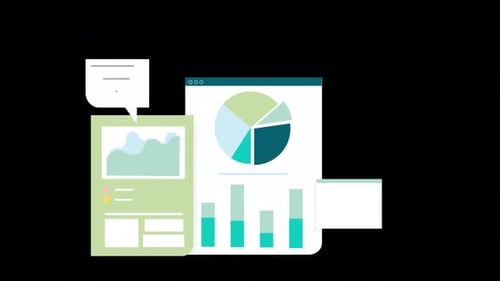
Animated Business Charts with Magnifying Glass Data Analysis
By ekanurmaOne great value subscription from $16.50/month
- Unlimited downloads of 27+ million creative assets
- AI Tools: video, image and more
- Lifetime commercial license
- Easy cancellation
- Length
- 0:07
- Resolution
- 3840 x 2160
- File Size
- 3.8 MB
- Frame Rate
- 30 fps
- Alpha Channel
- No
- Looped
- No
- Video Encoding
- H.264
- Orientation
- Horizontal
- Commercial License
- Further Information
Description
This animated visual effect presents a clean, flat design interpretation of data analysis. Three distinct infographic elements — a bar chart, a pie chart, and a process flow diagram — are introduced with dynamic, smooth animations. As these data visualizations come to life, a magnifying glass icon slides across the screen, drawing attention to different sections and simulating a detailed inspection of the information. Rendered in a modern, professional color palette against a light background, this animation is ideal for corporate presentations, business reports, educational videos, or any project requiring a clear and engaging display of data. It enhances the narrative by visually representing complex information in an easily digestible format, perfect for illustrating financial growth, market trends, or project milestones.