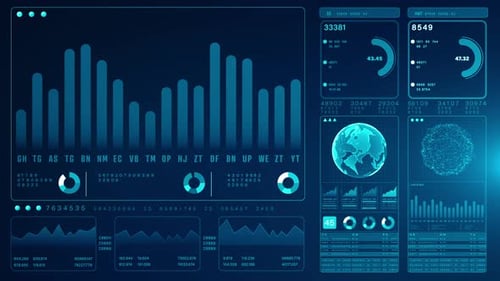
Blue Digital Stock Market Interface with Dynamic Economic Indicators
By KanawatTHOne great value subscription from $16.50/month
- Unlimited downloads of 27+ million creative assets
- AI Tools: video, image and more
- Lifetime commercial license
- Easy cancellation
- Length
- 0:20
- Resolution
- 3840 x 2160
- File Size
- 2.31 GB
- Frame Rate
- 30 fps
- Alpha Channel
- No
- Looped
- No
- Video Encoding
- ProRes
- Orientation
- Horizontal
- Commercial License
- Further Information
Description
A dense array of digital data visualizations glides across the screen, featuring active line graphs, rising bar charts, and rotating pie charts. The background includes a subtle world map overlaid on a glowing blue grid, with floating numerical values and percentages that update continuously. The energy of the visual is professional and high-tech, utilizing a monochromatic blue palette with crisp white typography and geometric symbols. The camera moves smoothly through a three-dimensional field, creating a sense of depth and complexity as various infographics slide into view. This visualization serves as a sophisticated backdrop for financial news, corporate presentations, or tech-themed content. It elevates the visual quality of business reports by providing a polished, data-rich aesthetic that communicates growth and global connectivity. The constant motion of the statistics and indicators provides an engaging sense of real-time market activity and analytical precision.