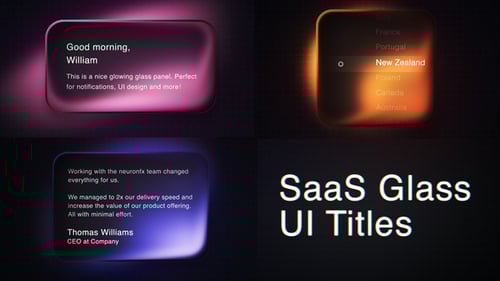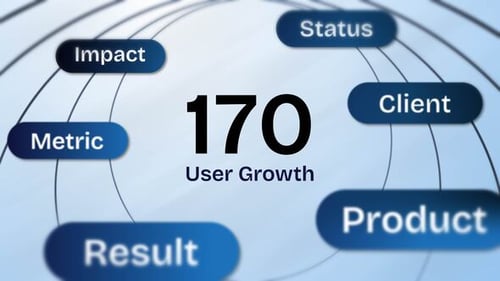
Animated Business Data Visualization Charts and SaaS Dashboard Metrics
By EasyFroxOne great value subscription from $16.50/month
- Unlimited downloads of 27+ million creative assets
- AI Tools: video, image and more
- Lifetime commercial license
- Easy cancellation
- Length
- 0:10
- Resolution
- 3840 x 2160
- File Size
- 4.44 MB
- Application Supported
- Premiere Pro
- Required Plugin
- None required
- Commercial License
- Further Information
Description
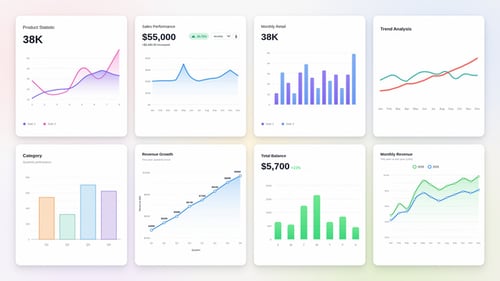
This video template features a comprehensive suite of animated data visualizations designed for software interfaces and corporate presentations. The collection includes various chart types such as dynamic line graphs, area charts with smooth transitions, modular bar graphs, and precise percentage indicators. Every element is crafted with a clean, minimalist aesthetic, utilizing a soft color palette and ample whitespace to ensure maximum readability and a professional look. Ideal for marketing, business reports, or financial dashboards, the motion design focuses on clarity and fluid data representation. The template is highly adaptable, allowing for quick integration of custom statistics and metrics while maintaining a sophisticated user interface style. Users can easily adjust the layouts to fit various screen orientations, making it a versatile tool for any data-driven storytelling project. Whether showcasing annual growth or monthly sales trends, these visuals provide a professional edge to any digital content.
Audio used in this item