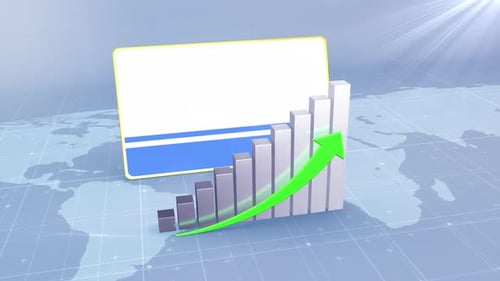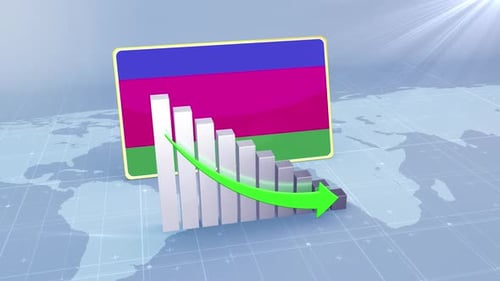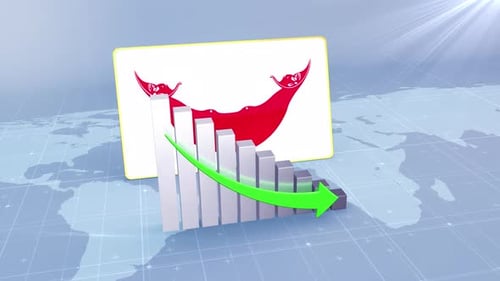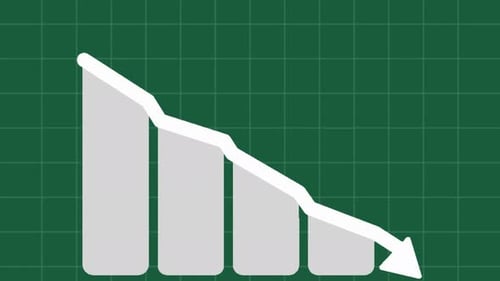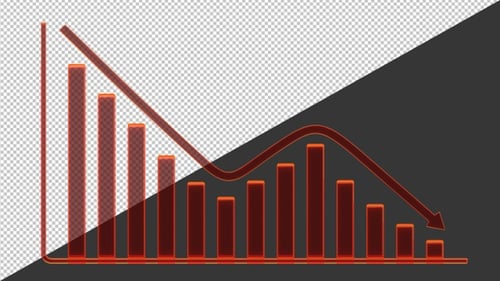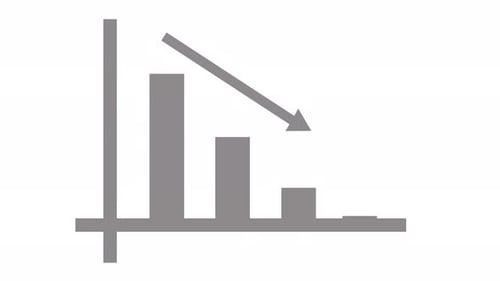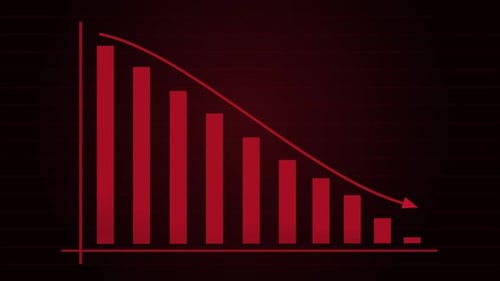
Modern 3D Bar Graph Showing Declining Data Trend
By moononOne great value subscription from $16.50/month
- Unlimited downloads of 27+ million creative assets
- AI Tools: video, image and more
- Lifetime commercial license
- Easy cancellation
- Length
- 0:11
- Resolution
- 1920 x 1080
- File Size
- 517 MB
- Frame Rate
- 29.97 fps
- Alpha Channel
- No
- Looped
- No
- Video Encoding
- ProRes
- Orientation
- Horizontal
- Commercial License
- Further Information
Description
This animated clip showcases a modern 3D bar graph dynamically illustrating a downward data trend. As the gray bars decrease in height, a vibrant green arrow visually confirms the declining movement, providing a clear and concise representation of negative growth. A clean, rectangular placeholder frame with a blue and white design is positioned behind the graph, ready to display key information or a company logo. The subtle background features a light blue world map grid, adding a global business context. This visual effect is ideal for corporate presentations, financial reports, economic analyses, and any project requiring a professional infographic to visualize declining metrics or adverse market conditions. The smooth animation and sleek design enhance informational videos, making complex data easily digestible for viewers.