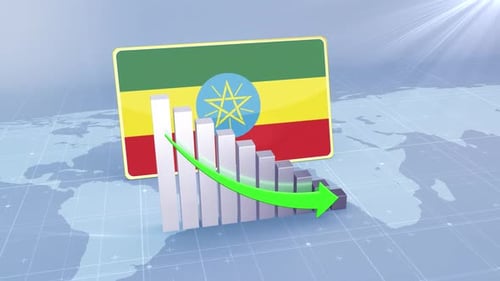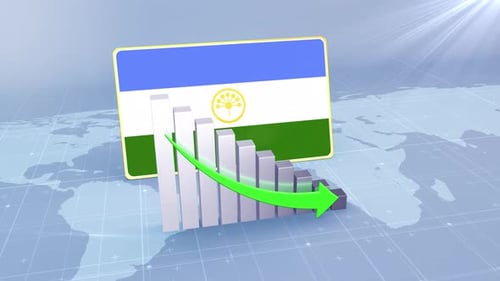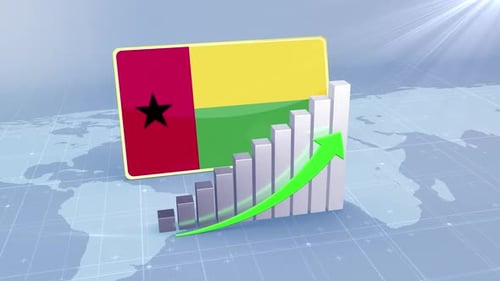
3D Bar Graph Showing a Decreasing Trend for Corporate Data Visualization
By moononOne great value subscription from $16.50/month
- Unlimited downloads of 27+ million creative assets
- AI Tools: video, image and more
- Lifetime commercial license
- Easy cancellation
- Length
- 0:11
- Resolution
- 1920 x 1080
- File Size
- 518 MB
- Frame Rate
- 29.97 fps
- Alpha Channel
- No
- Looped
- No
- Video Encoding
- ProRes
- Orientation
- Horizontal
- Commercial License
- Further Information
Description
This animated clip displays a dynamic 3D bar graph illustrating a significant downward trend. Tall, light grey bars gradually decrease in height from left to right, while a bright green arrow elegantly sweeps along their peaks, reinforcing the negative progression. A rectangular panel, framed in gold with a white and blue/red border, acts as a prominent placeholder for custom content. The entire scene is set against a subtle, light blue world map grid background, suggesting a global context for data analysis. Gentle light rays emanate from the top right, adding a professional polish. This visual effect is ideal for corporate presentations, financial reports, or any project needing to clearly communicate a declining metric or negative business outcome with a clean, modern aesthetic.